back to the future
February 2, 2011
Just a brief note to say that I haven’t abandoned all hope of getting this site going again. Even though I’m not playing MMOs at the moment, it seems a shame to just leave everything sit idle. My basic infrastructure runs without too much effort, so it is no great problem to refresh the data every couple of months.
The main obstacle is that Blizz is now serving the up-to-date data from battle.net in HTML format rather than XML. My page-scraping code needs to change to cope with that. Fortunately however the Blizz engineers are serving up valid XHTML, which means that XPath expressions can still be used to extract the data we need.
If I’ve been a good little engineer then only my XPaths need to change and nothing else…
There is a danger that the XPath paths can become more than a bit baroque because they have to navigate through all the HTML markup to get to the data nodes, although there are tricks to get the XPath engine to do a lot of the searching.
Anybody looking for inspiration on how to parse the battle.net XHTML should check out these posts by a geek blooger called Kastang. That’s the method I’ll be using when I get back to all this.
the talented Mr Druid
July 28, 2010
Now that we’ve got a dataset which can give us feral druids who:
- are consistently geared and spec-ed and
- are serious participants in instance-running and raiding
then we can move to the next stage: trying to find ways to partition that set into bears and cats.
This is where the visualization tools in a datamining package really come into their own. We can add a third dimension to any cluster by using colour. And we can quickly iterate through all the data dimensions to see which ones produce the best clusters. In these charts I’m filtering out all ferals druids with spellpower gear and all who have run fewer than 75 instances or raids.
I’m still plotting health vs mana, to keep the charts consistent across posts, but we’re getting close to the point where we will have to find different stats to graph. We know now that mana is irrelevant and health only a partial indicator of tank-ness. But for the time being, the main cluster that results from that plot is good enough.
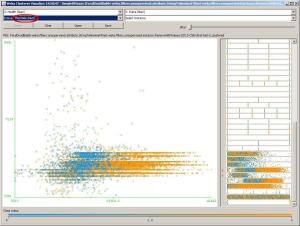
Now we want to know which talents can partition the cluster. (And we could ask the same question of glyphs or character stats too.) How about Primal Gore? This is the result – not a lot of partitioning going on there:
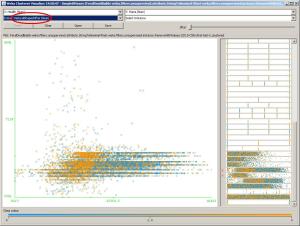
Thanks to various comments, it’s clear that there are a set of talents which people expect to effectively partition the cluster. Popular suggestions have included: Thick Hide, Natural Reaction and Protector of the Pack for bears and Shredding Attacks, Predatory Instincts, King of the Jungle, Survival Instincts and Natural Shapeshifter for cats.
Now we can look at each of those in detail:
Bear:
Cat:
You can see that some talents appear to be better than others at defining two distinct clusters. They all have a bit of partitioning effect, but some are better than others at producing the largest “distance” between the two clusters. Predatory Instincts produces clear gold and light blue clusters but Natural Shapeshifter produces more of a greenish middle ground which means that many players in both camps have put a point or two into it.
Datamining clustering algorithms work by calculating “distances” between data points along each of the data dimensions then aggregating those distance measures across all the dimensions. For example, the distance between a toon which has 3 points in Thick Hide and a toon which has zero points in the talent could be measured as “3” and then a sum of all distances could produce a measure of how distinct one toon is from another (although the algorithms generally use more sophisticated maths than just that.)
So we want the talents with the greatest distance between the two clusters. You can have a look at the charts and see which ones you think are the best ones. I’ll put up my numbers on that in the next post.
Now if we use the better of those talent dimensions as inputs to our clustering algorithm we get this:
The crucial thing here is that the blue cluster, which are the toons with bear-ish talents, extends right along the health x-axis. No doubt serious tanks are picking gear, gems and enchants that boost health. But since we are looking for a count of all tanks, all the way from those running 5-toon instances to those in the endgame raids, we should expect that there will be a wide spread of health between those just starting out and those nearer the end of the raiding dungeon chain.
That’s one reason why I’m about to abandon the health vs mana thing and move onto other character stats. More about that in the next post. But the reason we can make decisions like that is due to the insights that this data visualization gives us.
the truth is in there
July 20, 2010
Thanks to all the correspondents who commented on my feral druids datamining experiment. I’m happy that I’ve got a reasonable estimate for the number of bear tanks now. But I’m holding back from putting up my final word on the subject since I’m trying to encourage a couple of people to write up their own analysis first.
You may recall we left off with a simple graph of health vs mana for level 80 feral druids that produced two very distinct clusters – a red and a blue one – sorta like one of those political maps of the USA except with all the republicans and democrats clumped together in separate parts of the country.
And the key question was… um… While we’re on that subject… Can anybody explain to me why those political maps always colour the conservatives red and the liberals blue? It’s very confusing to a foreigner since just about everywhere else in the world, red is associated with the left or progressive side and blue with the Tory or conservative side.
Remember that great movie from the Reaganite ’80s? It was Red Dawn, not Blue Dawn. But I digress…
And the key question was: what were those red ferals doing at the high mana end of the scale? I had my doubts that there could be so many toons carrying mismatched specs and gear. But I’ve been convinced that, yes, there is something not quite right there. A simple filter that drops those toons in the sample with significant spellpower gear basically makes the red cluster disappear.
Now that might not sound like progress – ending up with one cluster – but don’t forget that the power of these datamining algorithms is that they cluster in multiple data “dimensions”. To the eye, there is one cluster, because we are drawing the graph in two “dimensions”: health and mana.
But as soon as we add some talent and glyph dimensions, the big blue blob starts to break up into separate clusters. And this time, there is a good match between the talents and glyphs that we expect to distinguish cats from bears and the actual location of each cluster in the multi-dimensional space.
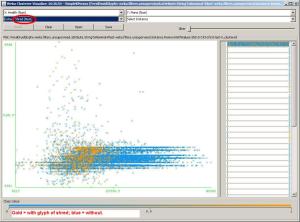
But it’s a whole lot easier to show you than to tell you, so I’ll leave you with a simple illustration of how that all works. We can add a third dimension to the graph by using colour. The datamining packages that I’m playing with are very good at that sort of visualization, as you can see here.
With the spellpower toons gone, the high mana group has also mostly gone and the shape of the blue cluster has become clearer as the graph scale has changed. Then we overlay, say, a cat glyph:
and a bear glyph:
and the clusters within the cluster become pretty clear. Thanks again to Narkondas for the key clues that inspired those graphs.
The datamining algorithms will generate a count of the toons in each cluster, but I’ll leave that till the next post. But as you can imagine, with a big clump of ferals filtered out, then the percentage of bear tanks in the overall mix is getting smaller.
I should also say that I’m about to collect a new data set and update my armoury reports since the data is getting a bit old and stale. As usual that will take a week or so.
feral druid forms yet again
July 9, 2010
A long, long time ago on a website far, far away there appeared a post which argued that feral druid bear tanks were in short supply. The article also made the perfectly reasonable point that armoury datamining sites had no data on the popularity of the various druid forms.
Now, being the kind of nerd who likes a challenge (is there any other kind?) I couldn’t let that one go past. But how to solve the problem? Druids get some of their forms through talents; easy enough to get a count of the toons invested in those talents. But cats and bears were not so straightforward.
As an old SQL hacker of the in Codd we trust school, my first cunning plan to get the numbers on feral druid bear tanks basically went like this:
- Mine data
- SELECT level 80 feral druids FROM toons
- GROUP BY ???
- Profit!
Unfortunately, that didn’t work so well, for a number of reasons. I now understand one very interesting reason why it didn’t work: the feral talents that we expected to use to identify cats and bears are not actually distributed that way. But more on that later.
The solution involved spending some time getting up to speed with more sophisticated datamining algorithms. These algorithms are also based on a sort of GROUP BY principle, but are capable of grouping (or “clustering”, as the datamining jargon has it) across multiple data dimensions. They can easily handle the 85 talents in the three druid trees and, in essence, can group samples of druids into clusters of toons in an 85-dimensional space. Alternatively, we can cluster on character stats – health, mana, strength, agi etc – or on any combination of talents, stats and playstyle numbers that interest us.
They also use calculus techniques to find the borders of each cluster in a way that can tolerate outliers. This is important in real life data, but also important in WoW data where there is always a small but significant number of players who insist on being… individuals…
Up until a few days ago, I was expecting to have to put off working on the druid forms question until I had a really good understanding of these algorithms. But that is not necessary, for the simple reason that the data we are dealing with is not all that complex. Consider the following graph:
Here we have selected for toons that have a history of running instances and raid dungeons, and have filtered out the toons that are serious PvPers. What we have are two groups that in essence are clustering themselves – no real datamining required.
The bottom, horizontal, group is emphasizing health over mana. This group is stacking stamina, agility, armour and dodge (I’ll prove all those things in the next post) and selecting some of the talents we’d expect for bears. In other words, Tanking 101. The top group is selecting for mana over health and is stacking intellect and spirit. This group has taken some of the cat talents too, although as we’ll see in the next post, talents do not seem to be a great predictor of role.
That graph was generated from a 500-toon data set. So we’re ready to cluster and count the full sample. And voilà:
You can see there are some outliers, but the bulk of the sample falls neatly into the two clusters. What you can’t see properly from the chart is that the blue tank cluster is in fact more populous than the red DPSers. It’s just that their health and mana stats don’t vary much, so the cluster is more dense. That’s where a clustering algorithm is needed to get a count of the population of each blob.
And the answer? There are 13, 187 level 80 feral druids in the sample who have done more than 75 instances and raids and have done no arenas. That’s my (s0mewhat generous) working definition of a PvE raider. It’s also a problematic definition because the arena stats are historical – they don’t prove that the toon was not geared up for raiding when the armoury snapshot was taken.
Of those raiders, 60% are in the blue tank cluster and 40% are in the red DPS cluster. So that’s one useful piece of information: feral druid raiders do seem to prefer to tank rather than DPS by a narrow majority.
But the PvE raiders are less than 1/2 of the total sample. So, the worst case scenario is that on any given day, only 30% of level 80 feral druids are set up for tanking (although, to repeat, it is not likely that every arena player is geared for PvP all the time).
The data is from patch 3.3.3.
Then there is the question of effective tanks. Some of those blue crosses in the bottom left hand corner of the chart are probably not seriously gearing up for very much at all. That will be the subject of the next post, when we will use some of the wonderful data visualization tools in these datamining packages to look much more closely into the dark heart of that big blue blob.
Meanwhile, if you’d like to play around with the data for yourself, here are the data sets I’m using. I’ve got a small set of feral talent builds, a larger set of builds and a large set of character stats. Each data set contains counts of instances and raids, battlegrounds and arenas played so you can filter on the raiders.
NB these data sets have been corrected and updated on 12 July. If you downloaded them before that, apologies for the error, and please download them again:
I know what you did last summer
March 15, 2010
So I’m working away here on my little teach yourself datamining in 21 days project. One thing that is distracting me is that I’m becoming aware of the possibilities of datamining not just games but RL™ itself.
The rise of the social web is making an enormous amount of data about the average person in the street available to be mined. We seem to be at some tipping point just now, where serious work is starting to be done on this (leaving aside the question of whatever serious datamining work has been done by various shadowy arms of government).
And, for better or worse, the data could be a lot more revealing than the sort of insights your supermarket might be collecting about you. They just pay people to figure out whether you’re more likely to buy beer or soft drink with your instant noodles. The stuff that’s potentially available from Twitter, Facebook and its like, and from the various tentacles of the googlepus makes that seem like small change indeed.
One of my favourite sites at the moment is floatingsheep. Highly worth a look if you’re a dataphile at heart.
You can see from that site that concerns about privacy can be greatly exaggerated. Datamining is more interested in social trends than what the individual might be up to. The same principle applies here: my reports deal with averages – what 100K gnomes do with their time, rather than what any single gnome might be doing – but it would be easy to drill down much lower if I felt it was worth it. If I collected the achievements data and tracked specific guilds or toons to-ing and fro-ing across Azeroth, the analogy would be even clearer.
There must be a point where people beyond the alfoil hat brigade start to get a bit upset by some of the implications of social datamining. Don’t forget that Blizz had to remove all the monetary data from the armoury statistics – and there’s no sign of that data coming back – and that’s just about a game. We saw something of what might happen in the fuss over Google Buzz. How long before we see more general concerns surface out there in Web-2.0-land?


